
Introduction to Gear Pumps and Their Industrial Importance
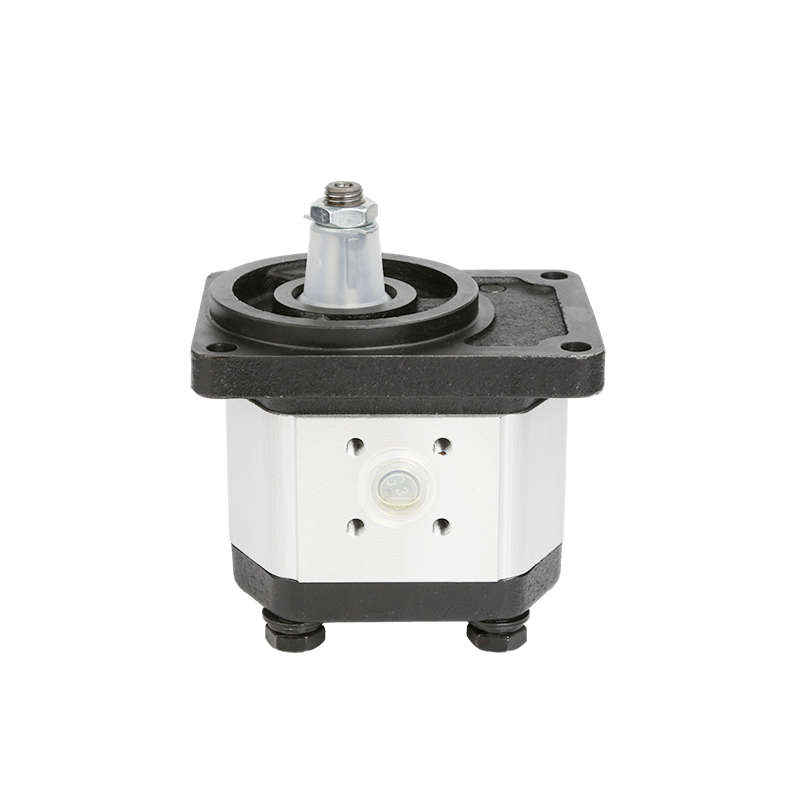
Gear pumps are commonly utilized in industrial settings needing steady fluid movement. They work by using interlocking gears. These gears form a vacuum to pull in and push out fluid. Their straightforward design, paired with strong efficiency and toughness, makes them vital in fields like farming, car production, and hydraulic setups. Gear pumps offer exact flow management. This applies to lubrication setups, fuel movement, or hydraulic systems. They remain a dependable option for diverse fluid-handling tasks.

Understanding the Gear Pump Performance Curve: A Comprehensive Guide
What Is a Gear Pump Performance Curve?
A gear pump performance curve is a chart showing how key factors connect. These factors include flow rate, pressure, efficiency, and energy use. This curve gives useful details about pump behavior in various situations. It helps engineers improve system layouts and pick the best pump for certain jobs. By studying these curves, users can keep a gear pump running in its best range. This cuts energy loss and wear on parts while boosting results.

Key Components of the Performance Curve
The gear pump performance curve has several key parts. These parts show how the pump works under different demands. A major link exists between flow rate and pressure. As pressure rises, flow rate often drops. This shows the balance between system pushback and pump ability. Efficiency measures also matter a lot. Volumetric and mechanical efficiency patterns reveal how well the pump turns energy into fluid motion. Plus, energy use info in the curve lets engineers check the pump motor’s load. This ensures it’s not too idle or too stressed.
Comparing Gear Pump Types Through Performance Curves
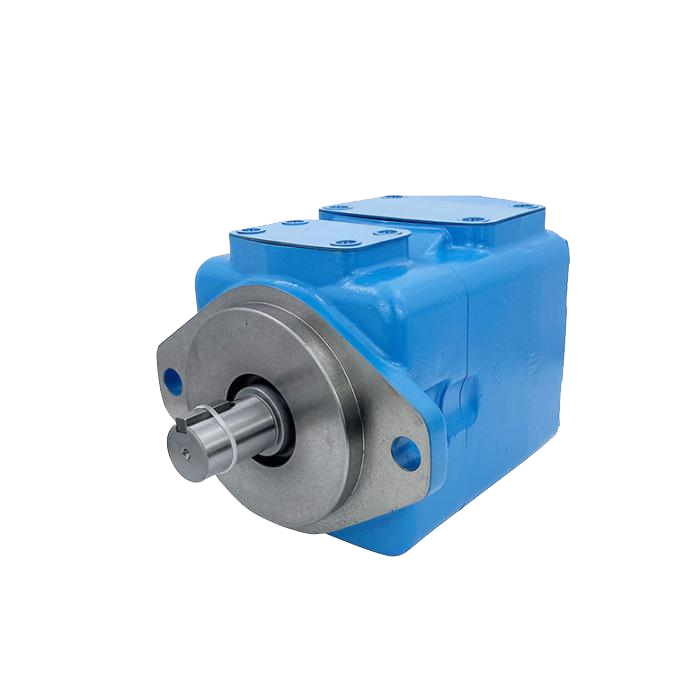
External vs. Internal Gear Pumps
Performance curves differ based on pump type—external or internal gear. External gear pumps handle higher pressures well. They show sharper pressure-flow curves. This suits them for tasks needing strong output. Meanwhile, internal gear pumps provide steadier flow at lower pressures. They fit jobs needing smooth, constant fluid motion without jerks. Knowing these traits helps engineers choose the right pump for system needs and limits.
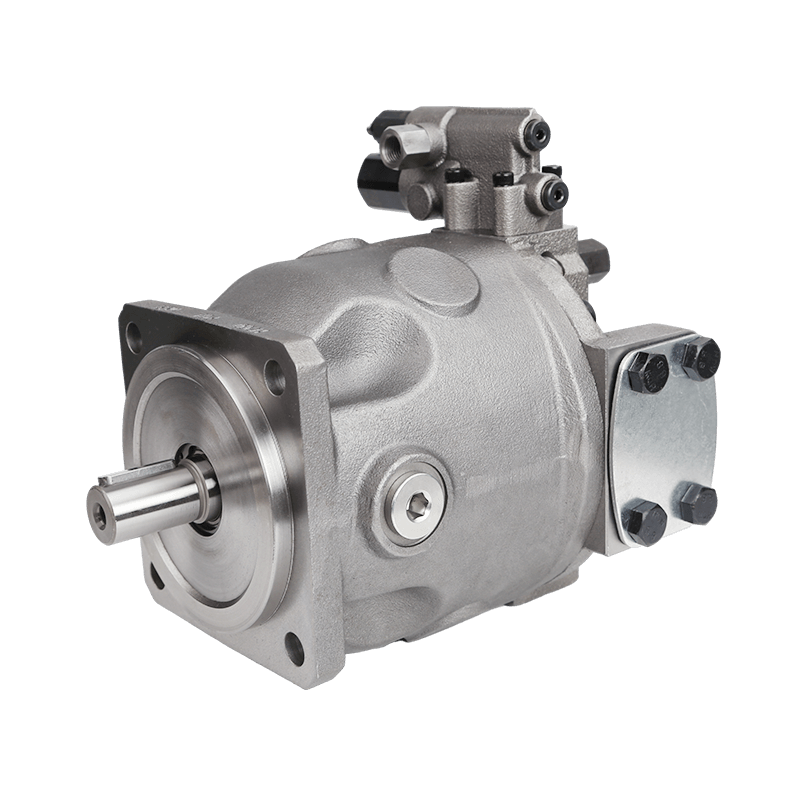
Fixed vs. Variable Displacement Models
Fixed displacement gear pumps keep a straight performance curve at steady speeds. They’re trustworthy for tasks needing consistent fluid supply. On the other hand, variable displacement models adjust flow rates. They give more flexible control. These pumps shift their curves based on current needs. This makes them more energy-saving in setups with changing flow demands. Adapting curves on the fly boosts flexibility and cuts excess energy use.
Factors Influencing the Gear Pump Performance Curve

Fluid Properties: Viscosity and Temperature
The fluid’s traits greatly affect the performance curve. Thick fluids often lower flow rates and raise torque needs. This pushes the curve downward. Likewise, temperature changes can tweak fluid actions. They impact efficiency and pressure spread. In cold settings, denser fluids may use too much energy. At higher temperatures, efficiency might drop due to more leaks and part stretching. Grasping these effects ensures correct reading of performance data. It aids in picking the right gear pump for specific uses.
Mechanical Wear and Aging Components
Over time, wear changes a gear pump’s performance traits. Worn gear teeth may flatten the pressure-flow curve. This signals an efficiency drop. Similarly, failing seals cause internal leaks. This lowers volumetric efficiency and hikes energy use. Routine upkeep and timely part swaps can maintain the original curve. It keeps the pump running at top efficiency. Using curve analysis for predictive upkeep can cut surprise breakdowns. It also extends the pump’s life.
Interpreting the Performance Curve for System Optimization
Matching the Pump to System Requirements
Reading a gear pump’s performance curve is key to matching it with system needs. The best operating zone, often called the “sweet spot,” cuts energy waste. It also avoids problems like cavitation. Running beyond advised pressure limits can cause loud noise, overheating, and early breakdowns. Engineers must study the curve to find the best operating spot. They balance flow rate, pressure, and energy use for top system output.
Real-World Applications of Curve Analysis
Curve analysis shines in real projects, like upgrading old hydraulic systems for better efficiency. Engineers study the current pump’s curve. They pick a more efficient replacement that fits system needs without wasting power. Costs matter too. Choosing a pump that fits the system exactly can avoid extra energy spending. It lowers long-term running costs.
Innovations in Gear Pump Performance Curve Analysis

Sustainability and Energy Efficiency
With rising eco-concerns, makers are tweaking gear pumps for better energy use. Refining curves for lower carbon impact helps systems use less power while staying productive. Pumps built to run in their best range cut overall energy costs. This aids greener operations. These steps match global pushes for better energy use in making and processing fields.
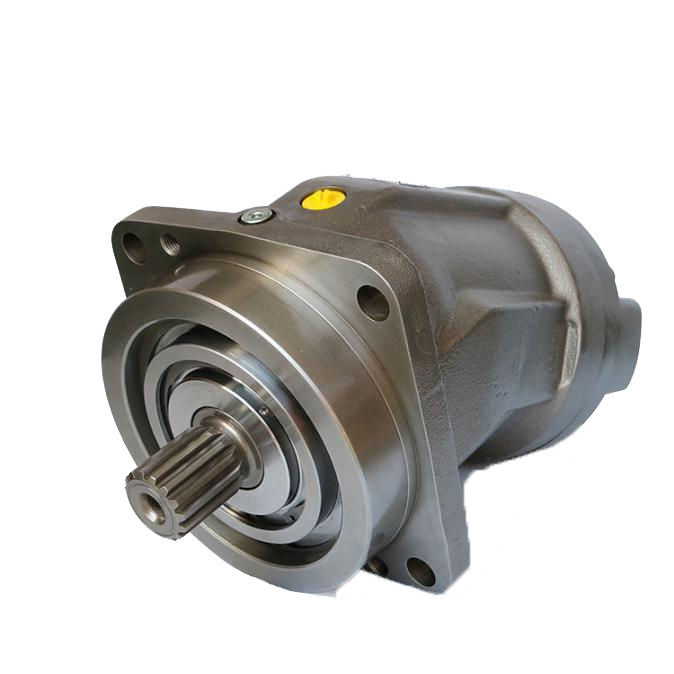
POOCCA Gear Pump Customization Service
POOCCA provides custom gear pump options. We refine performance curves for specific fluids, pressures, and work settings. Our tailoring ensures smooth fit with your system. It boosts efficiency and lifespan.
Frequently Asked Questions (FAQs)
Why is the gear pump performance curve critical for system design?
The curve keeps a pump in its efficient zone. This lowers energy costs and part wear. Good curve study improves pump choice and system tuning.
How does fluid viscosity alter the performance curve?
Thicker fluids cut flow rates and raise torque needs. This shifts the curve downward. Knowing this helps pick the right pump and tweak system settings.
Can a gear pump’s performance curve change over its lifespan?
Yes, wear and aging parts can drop max pressure and efficiency by 15–20%. Regular care is vital to keep performance strong.
Optimize Your System with Precision – Connect with POOCCA!
Ready to use gear pump performance curves for top efficiency? Contact POOCCA for a free consult for your gear pump customization . Let’s build your perfect fluid system together!